Research Article | | Peer-Reviewed

Association Between Glycated Hemoglobin and Lipid Biomarkers in Diabetic and Non-diabetic Populations for Type 2 Diabetes Detection

Received: 5 January 2025     Accepted: 21 January 2025     Published: 10 February 2025
Views:       Downloads:
Abstract

Introduction: Type 2 diabetes is a significant global health concern, necessitating a thorough understanding of its metabolic processes for effective management. The role of glycated hemoglobin (HbA1c) is crucial, particularly in relation to lipid biomarkers, which warrants exploration to enhance early detection and prediction of diabetes risk in individuals. Objective: This study aimed to explore the associations between HbA1c and lipid biomarkers in diabetic and non-diabetic individuals and to identify key predictors of type 2 diabetes. Methods: A case-control study at the Central Hospital of Yaoundé involved 70 type 2 diabetes patients and 67 non-diabetic controls. Data on sociodemographic characteristics, blood pressure, and biochemical markers were analyzed using Principal Component Analysis, Spearman’s rank correlation, multivariate linear and logistic regressions, and LASSO logistic regression. Results: The findings demonstrate a differential relationship between HbA1c and HDL-cholesterol in diabetic and non-diabetic groups, with diabetics exhibiting distinct metabolic profiles illustrated with lipid levels more closely associated with obesity and inflammation. Among non-diabetic participants, HbA1c was significantly inversely associated with HDL cholesterol (r = -0.337, p = 0.006), while in diabetic participants, it was positively associated with fasting blood glucose (r = 0.277, p = 0.023). Multivariate linear models indicated that the negative association between HDL cholesterol and HbA1c in non-diabetic participants was glycemia-independent. The predictive model identified HbA1c, age, education level, marital status, HDL cholesterol, and C-reactive protein as key predictors of type 2 diabetes, demonstrating high performance with a pseudo-R-square value of 0.8517, sensitivity of 94.03%, specificity of 96.97%, and an AUC of 0.9948. Notably, the adjusted cutoff value of HbA1c was 7.59%, significantly higher than the unadjusted value of 6.05% (t = 13.52, p = 0.001). Conclusion: The study shows a distinct relationship between HbA1c and HDL-cholesterol, linking diabetes to lipid levels, obesity, and inflammation. These findings emphasize context-specific HbA1c interpretation for better diabetes risk prediction and management.

Published in International Journal of Diabetes and Endocrinology (Volume 10, Issue 1)
DOI 10.11648/j.ijde.20251001.11
Page(s) 1-16
Creative Commons

This is an Open Access article, distributed under the terms of the Creative Commons Attribution 4.0 International License (http://creativecommons.org/licenses/by/4.0/), which permits unrestricted use, distribution and reproduction in any medium or format, provided the original work is properly cited.

Copyright

Copyright © The Author(s), 2025. Published by Science Publishing Group

Keywords

HbA1c, Lipid Biomarkers, Predictive Model, Sociodemographic Factors, Type 2 Diabetes

1. Introduction
Diabetes mellitus, particularly type 2 diabetes (T2D), is a chronic metabolic disorder characterized by hyperglycemia resulting from insulin resistance, impaired insulin secretion, or both . The increasing prevalence of type 2 diabetes (T2D) has emerged as a significant global public health challenge, affecting over 537 million adults worldwide as of 2021, according to the International Diabetes Federation (IDF). This figure is expected to rise dramatically, with projections estimating 643 million by 2030 and 783 million by 2045 .
Accurate diagnosis and risk assessment are crucial for the effective management of diabetes, and HbA1c has emerged as a standard biomarker for diagnosing and monitoring glycemic levels . HbA1c reflects average blood glucose concentrations over the previous two to three months, making it essential for long-term glucose monitoring . However, the relationship between HbA1c and various metabolic biomarkers, including fasting blood glucose (FBG), triglycerides (TG), and high-density lipoprotein (HDL) cholesterol, is complex and necessitates a nuanced investigation .
Research has demonstrated that HbA1c levels correlate significantly with FBG, making HbA1c an important tool for assessing glycemic status . Elevated FBG levels are a hallmark of insulin resistance, and the association between FBG and HbA1c is particularly pronounced among certain population subgroups, such as those with obesity or metabolic syndrome . Moreover, triglycerides, as a type of fat found in the bloodstream, have been implicated in the development of T2D due to their association with insulin resistance and inflammation . High levels of triglycerides can disrupt the metabolic pathways that involve glucose, thus elevating the risk of developing diabetes .
Conversely, low levels of HDL cholesterol are considered a risk factor for T2D, as HDL is known for its role in reverse cholesterol transport and its anti-inflammatory properties . A well-established link exists between low HDL cholesterol levels and increased insulin resistance, which can exacerbate the progression of T2D . Understanding how these interconnected biomarkers relate to HbA1c across various population segments is essential for refining diabetes risk assessment and improving clinical outcomes .
Studies have shown that the strength of these associations can vary significantly based on demographic factors, including age, sex, and ethnicity . For instance, Asian populations have been noted to display a stronger relationship between HbA1c and FBG than other ethnic groups, which could be attributed to different genetic backgrounds influencing glucose metabolism . Additionally, evidence suggests that gender differences in metabolic profiles can also affect the relationship between HbA1c and various lipid parameters . Therefore, assessing HbA1c in conjunction with lipid profile biomarkers in diverse subgroups could provide critical insights into the pathophysiology of insulin resistance and T2D development.
The optimal HbA1c cutoff values for diabetes diagnosis are pivotal in clinical practice. While the American Diabetes Association has set a threshold of 6.5% (48 mmol/mol) for diagnosing diabetes, this cutoff has been debated, particularly in populations with lipid abnormalities . Some studies have proposed the need for adjusting the cutoff value based on the presence of other risk factors, such as triglyceride levels, which may modify the risk associated with specific HbA1c levels . Adjusting the HbA1c cutoff could facilitate earlier detection of T2D, improving prevention efforts and enabling more effective management strategies .
What remains underexplored is the impact of confounding factors, including age, sex, ethnicity, and lifestyle behaviors, on the relationship between HbA1c and the aforementioned metabolic biomarkers . These factors can significantly alter the interpretation of HbA1c as a diagnostic tool and complicate the establishment of a standardized approach to diabetes screening . Understanding the influence of these confounding factors is vital to developing tailor-made risk assessment strategies for diabetes across various subpopulations .
This study sets out to assess the associations between HbA1c and various biomarkers, namely fasting blood glucose, triglycerides, and HDL cholesterol, in different population subgroups. Furthermore, it aims to establish an adjusted cutoff value for HbA1c to predict T2D, considering the impact of confounding factors such as lipid profiles. This comprehensive approach will be instrumental in enhancing the prediction and management of type 2 diabetes, paving the way for individualized treatment strategies and targeted public health interventions.
2. Materials and Methods
2.1. Study Site and Study Design
The study was conducted at the Yaoundé Central Hospital, a medical facility located in Yaoundé, in the Center Region of Cameroon within the Yaoundé II municipality. Specifically, the study occurred at the National Obesity Center and Endocrinology Unit within the hospital premises.
A hospital-based, unmatched case-control study was conducted at the Yaoundé Central Hospital.
2.2. Study Population
The study targeted individuals with type 2 diabetes and non-diabetic individuals attending the National Obesity Center and Endocrinology Unit of the Yaoundé Central Hospital.
2.3. Sampling Size Calculation
The sample size was determined using the formula by Jaykaran and Tamoghna . Considering a control-to-case ratio of 1, 0.84 for 80% power, 1.96 for a 0.05 significance level, and the proportion exposed in the control group of 5.8% as reported by Bigna et al. , the minimum sample size required was 126 individuals, comprising 63 cases and 63 controls.
2.4. Sampling Procedure
Due to the hospital-based nature of the study, all individuals with and without diabetes were approached during their regular clinic visits using convenience sampling.
2.5. Selection Criteria
Participants included individuals aged 20 years and above with type 2 diabetes and non-diabetic individuals visiting the National Obesity Center and Endocrinology Unit of the Yaoundé Central Hospital who provided consent to participate. Exclusion criteria encompassed individuals with severe chronic illnesses affecting metabolic profiles, those undergoing treatment for specific medical conditions, pregnant women, individuals on medications impacting glucose or lipid profiles other than standard diabetes medications, and those with incomplete data on essential characteristics or biomarkers.
2.6. Ethical Considerations
The study obtained approval from the Center Regional Ethics Committee for Human Health Research (approval number 006/CRERSHC/2023). Participants were informed about the study's objectives, procedures, risks, and benefits, and their confidentiality was strictly maintained. Blood collection followed WHO guidelines, ensuring participant safety and confidentiality.
2.7. Data Collection
Data were collected using a structured questionnaire covering demographic details, anthropometric measurements, blood pressure readings, and biochemical parameters.
2.8. Parameter Measurements
In compliance with standardized protocols, weight and height measurements were conducted on participants to the nearest 0.1 kilogram for weight measurement and to the nearest 0.1 cm for height measurement. The Body Mass Index (BMI) was then computed by dividing the weight by the square of the height.
Blood pressure (BP) was determined utilizing a mercury sphygmomanometer (Omron M3, Omron Healthcare Co., Ltd., Kyoto, Japan) (adult size) through the auscultatory method. Systolic blood pressure (SBP) was identified at the onset of the first Korotkoff sound, while diastolic blood pressure (DBP) was noted at the point of sound cessation. Blood pressure categorization aligned with the 2017 ACC/AHA/AAPA/ABC/ACPM/AGS/APhA/ASH/ASPC/NMA/PCNA Guideline , setting normal blood pressure as SBP <120 mmHg and DBP < 80 mmHg.
Blood collection adhered to World Health Organization (WHO) standards . Venous blood samples were drawn following a minimum 12-hour fast, ensuring prompt handling and processing to preserve sample integrity. Trained phlebotomists executed all blood collection processes, maintaining standard protocols to reduce contamination risks.
Serum glucose concentration analysis utilized the glucose oxidase 4-aminoantipyrine peroxidase (GOD-PAP) method . Furthermore, the Finecare™ HbA1c Rapid Quantitative Test assessed glycated hemoglobin (HbA1c) levels by processing whole blood samples collected into tubes with ethylene diamine tetraacetate (EDTA) as an anticoagulant. The test process included loading the sample on the Test Cartridge and generating results post-incubation. C-reactive protein (CRP) levels were determined via latex-enhanced nephelometry using the PA54 Specific Protein Analyzer.
Fasting blood samples, collected after a minimum 12-hour fast, and total cholesterol levels were estimated using the cholesterol oxidase 4-aminoantipyrine peroxidase (CHOD-PAD) method with spectrophotometric measurement. High-density lipoprotein (HDL) cholesterol estimation employed the cholesterol oxidase peroxidase (CHOD-POD) method, while triglyceride levels were determined via the glycerophosphate oxidase peroxidase (GOD-PAP) method. The calculation of low-density lipoprotein (LDL) cholesterol involved applying the Friedewald equation .
According to the guidelines of the United States National Cholesterol Education Program, Adult Treatment Panel III (NCEP-ATP III) , an abnormal lipid profile is defined as having one or more of the following: total cholesterol (TC) ≥ 200 mg/dL, HDL-cholesterol (HDL-c) < 40 mg/dL, LDL-cholesterol (LDL-c) ≥ 130 mg/dL, triglycerides ≥ 150 mg/dL, and a TC/HDL-c ratio ≥ 5.
2.9. Data Quality Control
The investigators underwent a one-day training session, followed by a presurvey conducted on 14 eligible diabetic patients to ensure consistency, and reliability, and to minimize intra- and interobserver variation. Supervision was provided by the main investigators throughout the data collection and analysis processes.
2.10. Statistical Analysis
In this study, a comprehensive statistical analysis was conducted to examine the relationships between various biomarkers and the occurrence of type 2 diabetes. Descriptive statistics were employed to summarize the data, with the mean and standard deviation reported for continuous variables, and frequency and percentage reported for categorical variables.
To assess the differential metabolic profile among diabetic and non-diabetic participants, multivariate logistic regression was used including an interaction term HbA1c_diabetes status using IBM-SPSS 26.0 for Windows (IBM Corporation, Armonk, NY, USA). To confirm the difference in metabolic profile in the two groups, principal component analysis was conducted using GraphPad Prism 9 (GraphPad Software, San Diego, CA, USA). To assess the strength of the relationships between HbA1c, fasting blood glucose, and lipid profile biomarkers, Spearman correlation coefficients were calculated. This analysis was followed by a multivariate linear regression to examine the association between fasting blood glucose, lipid profile biomarkers, and HbA1c. Both unadjusted and adjusted coefficients were reported, along with 95% confidence intervals and p-values. This allowed for the identification of significant predictors while controlling for potential confounding variables. All these analyses were performed using IBM-SPSS 26.0 for Windows (IBM Corporation, Armonk, NY, USA).
To develop a predictive model for the occurrence of type 2 diabetes, LASSO (Least Absolute Shrinkage and Selection Operator) logistic regression with cross-validation was employed. The coefficients, adjusted odds ratios, and 95% confidence intervals were reported for this model. The model's performance was evaluated using a range of metrics, including Pseudo R2, log-likelihood, sensitivity, specificity, positive predictive value, negative predictive value, area under the curve (AUC), mean squared error (MSE), root mean squared error (RMSE), mean absolute error (MAE), accuracy, Akaike Information Criterion (AIC), and Bayesian Information Criterion (BIC). These metrics provide a comprehensive assessment of the model's predictive ability and its fit to the data.
The Receiver Operating Characteristic (ROC) curve, coupled with the Youden index, was used to generate corrected and uncorrected cutoff values of HbA1c. A one-sample t-test was then used to compare the corrected cutoff value to the uncorrected and recommended cutoff values, ensuring the validity and reliability of the identified thresholds. The predictive LASSO logistic regression using cross-validation was computed using Stata Release 16 (StataCorp LLC, College Station, TX, USA), with the significance level set at 0.05 to ensure the results are statistically significant.
Charts and graphs were created using GraphPad Prism 9 (GraphPad Software, San Diego, CA, USA) and MS Excel 365 (Microsoft Corporation, Redmond, WA, USA).
3. Results
3.1. General Characteristics of the Population
Table 1 summarizes the general characteristics of the study population. The findings of this case-control study offer several key insights into the characteristics and health profiles of diabetic and non-diabetic individuals. The study sample, comprising 137 participants, was evenly divided between diabetic (n=70) and non-diabetic (n=67) individuals, with a majority being female (70%). Notably, the diabetic and non-diabetic groups were statistically homogeneous regarding sex (p=0.557), indicating no significant gender bias. However, diabetic participants were significantly older than their non-diabetic counterparts (p<0.001), with an average age of 45.4 years across the entire population.
Table 1. Sociodemographic characteristics of diabetic cases and controls.

Variables

Diabetic (n=70)

Non-diabetic (n=67)

Total

p-value

Sex – N (%)

Male

22 (31.4)

18 (26.9)

40 (29.2)

0.557

Female

48 (68.6)

49 (73.1)

97 (70.8)

Age (years) – Mean (SD)

56.8 (12.6)

33.4 (11.9)

45.4 (17.0)

< 0.001

Education – N (%)

None

3 (4.3)

0 (0.0)

3 (2.2)

< 0.001

Primary

19 (27.1)

5 (7.5)

24 (17.5)

Secondary

34 (48.6)

11 (16.4)

45 (32.8)

Post-graduate

14 (20.0)

51 (76.1)

65 (47.5)

Marital status – N (%)

Single

7 (10.0)

47 (70.1)

54 (39.4)

< 0.001

Widow

16 (22.9)

3 (4.5)

19 (13.9)

Divorced

2 (2.9)

2 (3.0)

4 (2.9)

Married

45 (64.3)

15 (22.4)

60 (43.8)

Profession – N (%)

Student

0 (0.0)

34 (50.7)

34 (24.8)

< 0.001

Housewife

17 (24.3)

2 (3.0)

19 (13.9)

Trader

3 (4.5)

12 (17.1)

15 (10.9)

Teacher

4 (6.0)

3 (4.3)

7 (5.1)

Tailor

1 (1.5)

3 (4.3)

4 (2.9)

Retired

3 (4.5)

17 (24.3)

20 (14.6)

Other

20 (29.9)

18 (25.7)

38 (27.7)

Body mass index – N (%)

Underweight

1 (1.4)

2 (3.0)

3 (2.2)

0.233

Normal weight

14 (20.0)

23 (34.3)

37 (27.0)

Overweight

33 (47.1)

24 (35.8)

57 (41.6)

Obese

22 (31.4)

18 (26.9)

40 (29.2)

Systolic blood pressure – Mean (SD)

135.4 (19.8)

121.4 (13.7)

128 (18)

< 0.001

Diastolic blood pressure – Mean (SD)

84.2 (11.9)

80.5 (10.7)

82 (11)

0.057

In terms of education, a significant majority (47.5%) of participants had attained at least a postgraduate level, with non-diabetic individuals achieving a higher education level compared to diabetic participants (p<0.001). Marital status also differed significantly between the groups; the highest proportion of the study population was married (43.8%), with diabetic participants more likely to be married than non-diabetic individuals (p<0.001). Conversely, non-diabetic participants were more likely to be single.
The distribution of professions varied significantly between the two groups (p<0.001), with a substantial proportion of participants being students (24.8%) or having other unspecified professions. Interestingly, the body mass index (BMI) was similar between diabetic and non-diabetic participants (p=0.233), with a high proportion of overweight individuals across the entire population (41.6%). This indicates that overweight status is a prevalent health issue regardless of diabetic status.
Regarding blood pressure, systolic blood pressure was significantly higher among diabetic participants (135.4 ± 19.8 mmHg) compared to non-diabetic participants (121.4 ± 13.7 mmHg) (p<0.001), suggesting a potential comorbidity of hypertension with diabetes. However, diastolic blood pressure did not differ significantly between the two groups (p=0.057).
3.2. Biochemical Parameters
The findings presented in Figure 1 reveal distinct biochemical profiles between diabetic and non-diabetic participants. Diabetic individuals exhibited significantly higher levels of glycated hemoglobin (7.5% vs. 5.1%, p < 0.001) and fasting blood glucose (1.7 g/L vs. 0.8 g/L, p < 0.001), indicating poorer long-term and short-term glycemic control. Interestingly, the levels of C-reactive protein, an inflammatory biomarker, were comparable between the two groups (p = 0.122), suggesting that diabetes was not associated with a significant increase in systemic inflammation in this study population. In terms of lipid profiles, diabetic participants had significantly higher triglyceride levels (1.7 g/L vs. 1.5 g/L, p < 0.001), as shown on Figure 2. However, other lipid parameters, including total cholesterol, HDL-cholesterol, LDL-cholesterol, and the total cholesterol/HDL-cholesterol ratio, did not differ significantly between the groups (p ≥ 0.05). These results underscore the importance of comprehensive management strategies for diabetic patients, focusing on both glycemic control and lipid management to mitigate the risk of associated health complications. Further research is needed to elucidate the underlying mechanisms and develop targeted interventions to improve health outcomes in individuals with diabetes.
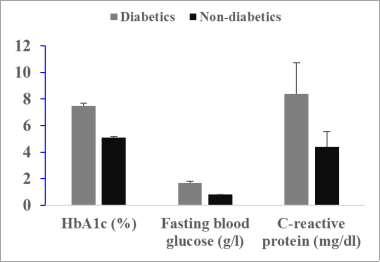
Figure 1. Distribution of HbA1c, fasting blood glucose, and C-reactive protein among diabetic and non-diabetic participants.
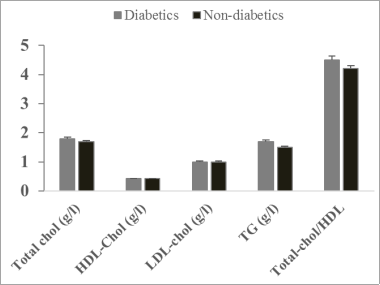
Figure 2. Lipid profile markers among diabetic and non-diabetic participants.
Legend: Total chol: total cholesterol, HDL-Chol: HDL-cholesterol, LDL-chol: LDL-cholesterol, TG: triglycerides.
3.3. Metabolic Patterns in the Diabetic and Non-Diabetic Participants
Logistic regression modeling, incorporating an interaction term (HbA1c_Diabetes status), was employed to determine whether the association between glycated hemoglobin (HbA1c) and lipid biomarkers differed between diabetic and non-diabetic participants (Table 2). The results indicated that the interaction term was not significant in the logistic regression models examining the relationship between HbA1c and LDL-cholesterol, triglycerides, total cholesterol levels, and the total cholesterol/HDL-cholesterol ratio (p ≥ 0.05). This suggests that there is no significant difference in the metabolic profile of the association between HbA1c and these lipid biomarkers.
However, the interaction term was significant in the logistic regression model involving HbA1c and HDL-cholesterol (adjusted coefficient = 1.01, p = 0.030). The positive coefficient indicates that the relationship between HbA1c and HDL-cholesterol is stronger in the diabetic group as compared to the non-diabetic group. This significant interaction term (HbA1c_Diabetes status) provides statistical evidence that the relationship between HbA1c and HDL-cholesterol differs between diabetic and non-diabetic groups.
Principal component analysis (PCA) loading plots were employed to compare the metabolic profiles of diabetic and non-diabetic participants (Figure 3). In non-diabetic individuals, PC1 was dominated by a lipid profile, including high loadings for total cholesterol, HDL-cholesterol, total cholesterol/HDL-cholesterol ratio, and LDL-cholesterol, while PC2 was characterized by a metabolic syndrome profile, with high loadings for HDL-cholesterol, total cholesterol, HbA1c, BMI, and age. In contrast, diabetic participants exhibited a shifted metabolic profile, with PC1 reflecting a lipid profile strongly associated with obesity (high loadings for total cholesterol, HDL-cholesterol, LDL-cholesterol, total cholesterol/HDL-cholesterol ratio, and BMI), and PC2 representing a lipid profile linked with inflammation (high loadings for total cholesterol, HDL-cholesterol, LDL-cholesterol, total cholesterol/HDL-cholesterol ratio, and C-reactive protein). These findings indicate that diabetes is associated with distinct metabolic profiles, where lipid profiles are more closely linked with obesity and inflammation compared to non-diabetic individuals.
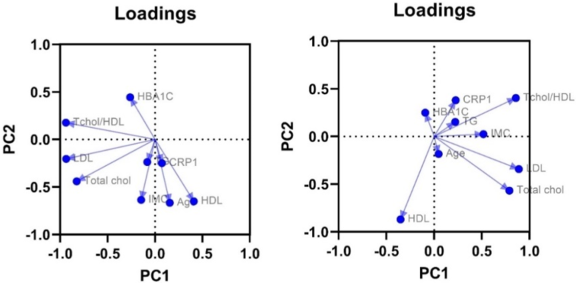
Figure 3. Loading plots of metabolic profiles of non-diabetic participants (on the left) and diabetic participants (on the right).
This finding highlights the distinct metabolic profiles of these two populations and underscores the importance of considering diabetic status when interpreting the relationship between HbA1c and dyslipidemia, particularly in the context of hypoalphalipoproteinemia.
3.4. Correlation Analysis
The correlation coefficients indicating the strength of the relationships between HbA1c and the other variables are presented in Table 3. The correlation analysis reveals distinct patterns of association between HbA1c and other variables in different subgroups of the population. In the overall population, HbA1c exhibited significantly positive association with fasting blood glucose and triglycerides (p < 0.05). The positive correlation (r = 0.667) between fasting blood glucose and HbA1c suggests that elevated fasting blood glucose levels are associated with higher HbA1c levels. Similarly, the positive correlation (r = 0.210) between triglycerides and HbA1c indicates that higher triglyceride levels are linked to elevated HbA1c levels.
Among non-diabetic participants, HbA1c was significantly associated only with HDL cholesterol (p < 0.05). The observed negative correlation (r = -0.337) suggests that lower HDL cholesterol levels are associated with higher HbA1c levels. In contrast, among diabetic participants, HbA1c was significantly associated only with fasting blood glucose (p < 0.05). The positive correlation (r = 0.277) observed between HbA1c and fasting blood glucose indicates that higher fasting blood glucose levels are associated with elevated HbA1c levels.
Table 2. Multivariate logistic models examining the association between lipid biomarkers, glycated hemoglobin, and confounders.

Variable

HDL-cholesterol

LDL-cholesterol

Triglycerides

Total cholesterol

TChol/HDL Ratio

Adj. β

p-value

Adj. β

p-value

Adj. β

p-value

Adj. β

p-value

Adj. β

p-value

HbA1c (%)

-1.03

0.013*

0.11

0.770

0.31

0.453

-0.48

0.356

1.53

0.331

Diabetes status

Yes

5.34

0.043*

-2.16

0.370

-4.07

0.144

1.59

0.611

-13.67

0.139

No

1

1

1

1

1

HbA1c_Diabetes status

1.01

0.030*

-0.20

0.626

-0.70

0.146

0.58

0.315

-2.14

0.191

Age (years)

-0.02

0.405

-0.03

0.212

-0.00

0.977

-0.03

0.306

0.01

0.870

Sex

Female

0.42

0.375

0.02

0.965

-0.04

0.930

0.07

0.910

0.46

0.603

Male

1

1

1

1

1

BMI

0.07

0.169

0.14

0.010*

-0.03

0.549

0.22

0.004*

0.08

0.156

Hypertension status

Elevated blood pressure

-0.28

0.621

-0.44

0.444

-0.50

0.463

-0.17

0.823

-0.93

0.395

Hypertension stage 1

1.21

0.220

-0.63

0.483

-0.82

0.369

-21.09

0.999

-19.48

0.999

Hypertension stage 2

-0.39

0.446

-0.74

0.154

-0.03

0.960

-0.37

0.576

-0.40

0.668

Normal

1

1

1

1

1

C-reactive protein (mg/dl)

-0.05

0.158

-0.02

0.262

0.03

0.465

-0.01

0.707

0.02

0.326

Education

Primary

2.12

0.152

0.98

0.510

-0.40

0.801

-0.06

0.974

0.41

0.834

Secondary

1.05

0.131

-0.24

0.712

0.60

0.495

0.14

0.862

-0.55

0.674

Post-secondary

0.94

0.096

-0.31

0.561

0.14

0.829

0.03

0.965

-0.23

0.821

None

1

1

1

1

1

Marital status

Widow

0.87

0.140

1.06

0.070

-1.31

0.056

1.82

0.017*

-0.01

0.990

Divorced

0.48

0.501

0.72

0.317

-1.27

0.119

1.99

0.029*

0.97

0.413

Married

1.41

0.266

-0.08

0.945

-1.22

0.358

0.76

0.584

-19.99

0.999

Single

1

1

1

1

1

TChol/HDL Ratio: Total cholesterol/HDL-cholesterol ratio, Adj. β: adjusted Coefficient, *p-value with this superscript was statistically significant (p < 0.05).
Table 3. Multivariate logistic models examining the association between lipid biomarkers, glycated hemoglobin, and confounders.

Variables

Spearman correlation

p-value

All participants

Fasting blood glucose

0.667

< 0.001*

Total cholesterol

0.049

0.576

HDL-cholesterol

-0.162

0.063

Total cholesterol/HDL ratio

0.181

0.037*

LDL-cholesterol

0.026

0.767

Triglycerides

0.210

0.006*

Non-Diabetic participants

Fasting blood glucose

-0.005

0.970

Total cholesterol

-0.044

0.723

HDL-cholesterol

-0.337

0.006*

Total cholesterol/HDL ratio

0.221

0.075

LDL-cholesterol

0.066

0.596

Triglycerides

-0.005

0.965

Diabetic participants

Fasting blood glucose

0.277

0.023*

Total cholesterol

-0.041

0.744

HDL-cholesterol

-0.070

0.574

Total cholesterol/HDL ratio

0.094

0.450

LDL-cholesterol

-0.011

0.932

Triglycerides

0.110

0.374

95% CI: 95% confidence interval and *p-value with this superscript was statistically significant (p < 0.05).
3.5. Multivariable Linear Regression Analysis
To elucidate the contribution of lipid profile biomarkers to HbA1c levels, multivariable analyses were conducted among the overall population and non-diabetic participants, specifically focusing on the influence of glycemia. Diabetic participants were not examined as an individual group due to the absence of a significant correlation between HbA1c and lipid profile biomarkers in the initial correlation analysis.
In the overall population, the unadjusted model (Model 1) revealed a significant association between triglycerides and HbA1c (Table 4). However, this association became non-significant after adjusting for fasting blood glucose (Model 2), suggesting that the relationship between triglycerides and HbA1c depends on glycemia. Furthermore, the association remained non-significant even after adjusting for fasting blood glucose and other potential confounders, including C-reactive protein, body mass index, sex, and age (Model 3). This further substantiates the dependence of the association on glycemia.
Table 4. Multivariate linear analysis of HbA1c in unadjusted, glycemia-adjusted, and fully adjusted models among overall participants.

Variable

Model 1 (Unadjusted)

Model 2 (Adjusted for glycemia)

Model 3 (Fully adjusted)

β

95%CI

p-value

Adj. β

95%CI

p-value

Adj. β

95%CI

p-value

Triglycerides

0.91

0.18, 1.64

0.015*

0.33

-0.32, 0.97

0.317

-0.01

-0.63, 0.60

0.964

Fasting blood glucose

1.14

0.83, 1.46

<0.001*

0.78

0.45, 1.10

<0.001*

CRP

0.00

-0.01, 0.02

0.868

BMI

-0.04

-0.09, 0.00

0.064

Sex

-0.20

-0.71, 0.31

0.443

Age

0.02

0.01, 0.04

0.009*

Education

-0.12

-0.47, 0.23

0.498

Marital status

0.21

0.02, 0.40

0.027*

Hypertension status

0.16

-0.05, 0.38

0.129

CRP: C-reactive protein, and BMI: Body mass index, 95% CI: 95% confidence interval, β: Coefficient, Adj. β: Adjusted coefficient, and *p-value with this superscript was statistically significant (p < 0.05).
Among non-diabetic participants, a significant negative association was observed between HDL-cholesterol and HbA1c (p = 0.011) in the unadjusted model (Table 5). This association persisted even after adjusting for fasting blood glucose (p = 0.011), indicating that the relationship is independent of glycemia (Model 2). Moreover, the association between HDL cholesterol and HbA1c remained significant (p = 0.044) even after adjusting for fasting plasma glucose (FPG) and the same potential confounders mentioned above (Model 3). This further supports the independence of the association from glycemia.
These findings underscore the importance of considering lipid profile biomarkers in the context of glycemia when interpreting HbA1c levels, particularly in non-diabetic individuals.
Table 5. Multivariate linear analysis of HbA1c in unadjusted, glycemia-adjusted, and fully adjusted models among non-diabetic participants.

Variable

Model 1 (Unadjusted)

Model 2 (Adjusted for glycemia)

Model 3 (Fully adjusted)

β

95%CI

p-value

Adj. β

95%CI

p-value

Adj. β

95%CI

p-value

HDL-cholesterol

-3.08

-5.45, -0.72

0.011*

-3.15

-5.56, -0.75

0.011*

-2.97

-5.86, -0.09

0.044*

Fasting blood glucose

-0.38

-2.30, 1.54

0.693

-0.25

-2.46, 1.96

0.820

CRP

-0.04

-0.09, 0.01

0.100

BMI

0.02

-0.02, 0.06

0.356

Sex

-0.12

-0.53, 0.28

0.542

Age

-0.01

-0.04, 0.02

0.446

Education

-0.07

-0.52, 0.38

0.745

Marital status

0.05

-0.15, 0.25

0.628

Hypertension status

-0.05

-0.23, 0.13

0.606

CRP: C-reactive protein, BMI: Body mass index, HDL: high-density lipoprotein, 95% CI: 95% confidence interval, β: Coefficient, Adj. β: Adjusted coefficient, and *p-value with this superscript was statistically significant (p < 0.05).
3.6. Development of a Predictive Model
To predict the HbA1c cutoff required to determine the presence of type 2 diabetes, a LASSO regression model was constructed using the following covariates: sex, age, education level, marital status, occupation, body mass index (BMI), hypertension status, high-density lipoprotein (HDL) cholesterol, low-density lipoprotein (LDL) cholesterol, total cholesterol, triglycerides, and C-reactive protein. Among these covariates, the LASSO regression identified HbA1c, age, education level, marital status, HDL-cholesterol, and C-reactive protein as significant predictors to be included in the final model. (Table 6).
The LASSO logistic regression model, developed to predict the HbA1c cutoff for detecting type 2 diabetes, demonstrated good performance across multiple evaluation metrics (Table 7). The model included independent variables such as HbA1c, age, education level, marital status, HDL cholesterol, and C-reactive protein. The pseudo-R-square value of 0.8517 indicated a strong goodness-of-fit, with a log-likelihood of -13.67. The model exhibited high sensitivity (94.03%) and specificity (96.97%), reflecting its ability to accurately identify both positive and negative cases. The positive predictive value (96.92%) and negative predictive value (94.12%) further underscored the model's reliability in predicting type 2 diabetes.
The Area Under the Curve (AUC) of 0.9948 indicated outstanding discriminatory power, suggesting that the model effectively distinguishes between individuals with and without type 2 diabetes. The Mean Squared Error (MSE) was 0.03052795, the Root Mean Squared Error (RMSE) was 0.0616976, and the Mean Absolute Error (MAE) was 0.0616976, all of which were notably low, indicating minimal prediction errors. The overall accuracy of the model was 95.49%, demonstrating its high predictive performance.
Additionally, the Akaike Information Criterion (AIC) of 41.34 and the Bayesian Information Criterion (BIC) of 61.58 suggested that the model strikes a good balance between fit and complexity. These metrics collectively highlight the robustness and reliability of the LASSO logistic regression model in predicting the HbA1c cutoff for detecting type 2 diabetes.
The odds of having type 2 diabetes increased by approximately 34.94 times for each one-unit increase in HbA1c levels, underscoring the critical role of HbA1c as a strong predictor. Additionally, the odds increased by approximately 22% for each one-year increase in age, indicating that older individuals are at a higher risk. Conversely, the odds decreased by approximately 7% for each one-unit increase in education level, suggesting that individuals with higher education levels may have a lower risk, possibly due to better health literacy and lifestyle choices. Marital status was also associated with an increased risk, with the odds of having type 2 diabetes increasing by approximately 19% for married individuals compared to those who are not. Notably, the odds increased by approximately 487.36 times for each one-unit increase in HDL-cholesterol levels, indicating a strong association that warrants further investigation. Lastly, the odds increased by approximately 7% for each one-unit increase in C-reactive protein levels, suggesting that higher levels of this inflammatory marker were associated with an increased risk of type 2 diabetes. These findings highlight the importance of HbA1c, age, education level, marital status, HDL-cholesterol, and C-reactive protein as significant predictors of type 2 diabetes, providing a parsimonious and interpretable model for predicting the risk of this condition.
Table 6. LASSO logistic analysis to predict type 2 diabetes using HbA1c and other confounders.

Variable

Coefficient

Odds ratio

p-value

Value

95% CI

Value

95%CI

HbA1c

3.55

1.62, 5.48

34.94

5.06, 241.27

< 0.001

Age

0.20

0.05, 0.35

1.22

1.05, 1.41

0.009

Education level

-0.07

-1.66, 1.52

0.93

0.19, 4.58

0.930

Marital status

0.17

-0.79, 1.13

1.19

0.45, 3.10

0.726

HDL-cholesterol

6.19

-4.69, 17.07

487.36

0.01, 2.58 107

0.265

C-reactive protein

0.07

-0.11, 0.25

1.07

0.90, 1.28

0.428

Constant

-33.58

-54.33, -12.82

2.62 10-15

2.53 10-24, 2.7 10-6

0.002

Table 7. Evaluation parameters to assess the quality of the developed LASSO logistic model.

Metric

Value

Pseudo R2

0.8517

Log-likelihood

- 13.67

Sensitivity

94.03%

Specificity

96.97%

Positive predictive value

96.92%

Negative predictive value

94.12%

Area under the curve (AUC)

0.9948

Mean Squared Error (MSE)

0.03052795

Root Mean Squared Error (RMSE)

0.0616976

Mean Absolute Error (MAE)

0.0616976

Accuracy

95.49%

Akaike Information Criterion (AIC)

41.34

Bayesian Information Criterion (BIC)

61.58

3.7. Predicting Adjusted HbA1c Cutoff
The Receiver Operating Characteristic (ROC) curve, coupled with the Youden index, was employed to compute the unadjusted and adjusted cutoff values of HbA1c (Figure 4). The results indicated that the unadjusted and adjusted cutoff values of HbA1c were 6.05% and 7.59%, respectively. These two cutoff values were found to be statistically different (t = 13.52, p = 0.001), suggesting that the effect of confounders led to an increase in the cutoff value of HbA1c. Furthermore, when comparing the adjusted cutoff to the recommended value for detecting type 2 diabetes using HbA1c (6.50%), the difference was also found to be statistically significant (t = 9.71, p = 0.001). This indicates that confounders, including HDL-cholesterol, contributed to a higher cutoff value of HbA1c.
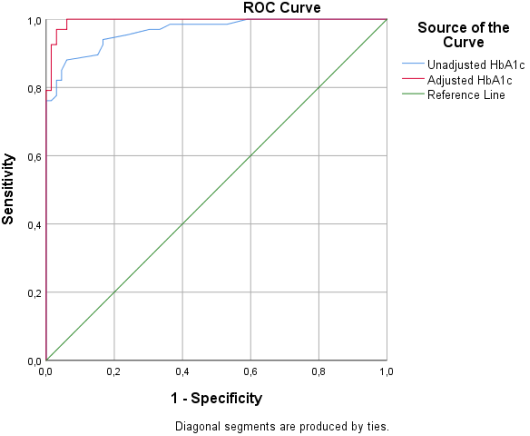
Figure 4. ROC curve of unadjusted and adjusted HbA1c.
4. Discussion
The results of this study suggest a differential relationship between HbA1c and HDL-cholesterol in diabetic and non-diabetic groups. Previous research has shown that diabetic individuals have significantly lower HDL levels compared to non-diabetic groups, indicating a more pronounced interaction between HbA1c and lipid levels in diabetic populations, influenced by diabetes status . Additionally, these findings highlight that diabetes is associated with unique metabolic profiles, where lipid profiles are more closely linked with obesity and inflammation. A previous study revealed that dysfunctional adipose tissue in obesity fosters a pro-inflammatory environment, contributing to type 2 diabetes, with visceral fat accumulation correlating with systemic inflammation and dyslipidemia factors more prominent in diabetic individuals than in non-diabetic counterparts .
The association between triglycerides and glycated hemoglobin (HbA1c) being dependent on glycemia is a complex relationship that has been observed in several studies. This present finding suggests that the link between lipid metabolism and glucose control is not straightforward and may be influenced by overall blood glucose levels.
Research has shown that elevated triglycerides are often associated with poor glycemic control in patients with diabetes. A study found that HbA1c can be an indicator of triglyceride level and can be one of the predictors of cardiovascular risk factors in type 2 diabetes mellitus . Elevated blood glucose levels can lead to increased triglyceride production, as excess glucose is converted into fatty acids and stored as triglycerides . Insulin resistance, common in type 2 diabetes, disrupts the regulation of both glucose and lipid metabolism, often resulting in higher levels of both HbA1c and triglycerides. Improved glycemic control, indicated by lower HbA1c levels, is associated with better lipid profiles, including reduced triglyceride levels . This supports the idea that there is a connection between HbA1c and triglyceride levels. Likewise, this relationship underscores the importance of comprehensive metabolic control in managing diabetes and reducing cardiovascular risk.
However, the relationship appears to be more nuanced when considering different levels of glycemia. Zheng et al. observed that elevated triglyceride levels were strongly associated with inadequate glycemic control, suggesting that the association may be more pronounced in individuals with higher blood glucose levels. This aligns with the finding that the relationship is dependent on glycemia.
Interestingly, some research has found that the association may not be as strong as previously thought. A study by Rodriguez-Gutierrez et al. concluded that triglycerides do not impair the interpretation of HbA1c assay. Patients and clinicians can now be confident that hypertriglyceridemia is not an important factor when interpreting HbA1c results. This contradicts the idea of a strong, direct relationship between triglycerides and HbA1c.
Thus, the complex interplay between glucose and lipid metabolisms could explain the dependency on glycemia. In individuals with higher blood glucose levels, insulin resistance may play a more significant role in affecting triglyceride levels and HbA1c, potentially strengthening their association. Conversely, in those with better glycemic control, other factors may have a more substantial influence on triglyceride levels, weakening the relationship with HbA1c.
The finding that the association between HDL-cholesterol (HDL-C) and glycated hemoglobin (HbA1c) is independent of glycemia among the non-diabetic population is an intriguing result that challenges some previous assumptions about lipid metabolism and glucose control. This relationship suggests that HDL-C levels may be influenced by factors beyond just blood glucose levels, even in individuals without diabetes.
A study by Huang et al. supports this finding, showing that HDL-C was inversely associated with glycosylated hemoglobin after adjusting for other covariates. This inverse relationship persisted even after accounting for various factors, indicating that the link between HDL-C and HbA1c is not solely dependent on glycemic status. However, it is important to note that this study was conducted on diabetic patients, which contrasts with the non-diabetic population mentioned in the current finding.
Interestingly, research by Gatti et al. found that poor glycemic control is an independent risk factor for low HDL cholesterol in patients with type 2 diabetes. While this seems to contradict the current finding, it is crucial to remember that the present finding focuses on non-diabetic individuals, where the mechanisms at play may differ.
The independence of the HDL-C and HbA1c association from glycemia in non-diabetics suggests that other mechanisms, such as inflammation, oxidative stress, or genetic factors, may play a role in this relationship. This aligns with the findings of Naqvi et al. , who observed that HbA1c can be an indicator of triglyceride level and can be one of the predictors of cardiovascular risk factors. Although this study focused on triglycerides rather than HDL-C, it supports the idea that HbA1c may reflect broader metabolic processes beyond just glucose control.
The current finding underscores the complex interplay between lipid metabolism and glucose homeostasis, even in non-diabetic individuals. It highlights the need for comprehensive approaches to cardiovascular risk assessment that consider both lipid profiles and glycemic markers, regardless of diabetic status. Further research is needed to elucidate the specific mechanisms underlying this independent association in non-diabetic populations.
The implications of these findings for detecting type 2 diabetes using HbA1c are that the dependence of the association between triglycerides and HbA1c on glycemia could lead to potential false positives or negatives in diabetes diagnoses, as elevated triglyceride levels might influence HbA1c levels even in the absence of hyperglycemia. Conversely, the independent association between HDL cholesterol and HbA1c in non-diabetic individuals suggests that low HDL cholesterol levels could serve as an early indicator of impaired glucose metabolism, even when HbA1c levels are within the normal range. This highlights the importance of comprehensive lipid profiling in diabetes screening and management, as evaluating triglyceride and HDL cholesterol levels alongside HbA1c can provide a more comprehensive understanding of an individual's metabolic health. Moreover, these findings imply that universal HbA1c cutoffs for diabetes diagnosis may not be suitable for all individuals, and further research is needed to determine whether lipid-specific or population-specific cutoffs could improve screening accuracy. Additionally, in individuals with dyslipidemia, HbA1c levels may not accurately reflect glycemic control, emphasizing the need for monitoring both lipid profiles and HbA1c levels to effectively manage their risk of diabetes and related complications. This led us to develop a predictive model of type 2 diabetes occurrence to predict the adjusted cutoff value of HbA1c in this study.
The LASSO logistic model has identified HbA1c, age, education level, marital status, HDL-cholesterol, and C-reactive protein (CRP) as significant predictors of type 2 diabetes. This finding aligns with existing literature that underscores the multifactorial nature of type 2 diabetes. For instance, HbA1c is a well-established marker for long-term glycemic control and is closely linked to diabetes management and complications . Age is another critical factor, as the risk of type 2 diabetes increases with advancing age . Education level and marital status are socio-demographic factors that influence health behaviors and access to health care, thereby affecting diabetes risk . HDL-cholesterol, often referred to as “good cholesterol,” has been shown to have an inverse relationship with diabetes risk, with higher levels being protective . Lastly, elevated CRP levels indicate inflammation, which is a known contributor to insulin resistance and type 2 diabetes . These findings collectively highlight the complex interplay of biological, and socio-demographic factors in the development of type 2 diabetes.
The use of the Receiver Operating Characteristic (ROC) curve, along with the Youden index, to determine the adjusted cutoff values of HbA1c for predicting type 2 diabetes is a robust method for enhancing diagnostic accuracy. The adjusted cutoff value of 7.59% for HbA1c, as indicated in the study, aligns with findings from other research that emphasize the importance of precise cutoff points in diabetes diagnosis. For instance, a study published by Zhou and Qin discussed how covariate adjustments in ROC analysis can refine cutoff values, thereby enhancing the predictive power of biomarkers like HbA1c. In contrast, some studies suggest that while adjusted cutoff values provide better individualized risk assessments, they may not significantly outperform traditional thresholds in broader population screenings . This underscores the need for a balanced approach in clinical practice, considering both adjusted and unadjusted values for comprehensive diabetes risk evaluation.
While the study provides valuable insights into the associations between HbA1c and various biomarkers, several limitations must be acknowledged. Firstly, the case-control study design, with a relatively small sample size, may limit the generalizability of the findings to the broader population. However, the detailed and rigorous data collection methods employed in this study enhance the reliability of the results.
Secondly, the study was conducted at a single center, the Central Hospital of Yaoundé, which could introduce selection bias and may not be representative of other healthcare settings or regions. Nonetheless, the comprehensive assessment of sociodemographic characteristics, blood pressure, and biochemical markers adds robustness to the analysis.
Thirdly, the case-control nature of the data collection does not allow for the establishment of temporal relationships or causality between the biomarkers and type 2 diabetes. Despite this, the use of advanced statistical techniques, such as multivariate LASSO logistic regression, provides a sophisticated approach to identifying predictors of type 2 diabetes.
Additionally, the study did not account for potential confounding factors such as lifestyle behaviors, dietary habits, and genetic predispositions, which could influence the associations observed. Nonetheless, the rigorous adjustment for key confounders, such as fasting blood glucose and other biomarkers, strengthens the validity of the findings.
Lastly, the adjusted cutoff value of HbA1c, while statistically significant, requires further validation in larger, more diverse populations to confirm its clinical utility. Despite this, the significant difference between the adjusted and unadjusted cutoff values highlights the importance of considering confounders in the diagnosis of type 2 diabetes.
5. Conclusions
This case-control study revealed significant differences in age, education, marital status, blood pressure, and biochemical profiles between diabetic and non-diabetic individuals. Diabetic participants were older, less educated, and more likely to be married than their non-diabetic counterparts. They also exhibited higher systolic blood pressure, poorer glycemic control, and elevated triglyceride levels. Future studies should aim to elucidate the underlying mechanisms linking these factors and develop targeted interventions to improve health outcomes in individuals with diabetes.
This study also reveals a complex relationship between triglycerides and glycated hemoglobin (HbA1c), dependent on glycemia, suggesting that lipid metabolism and glucose control are intricately linked.
The findings of this study suggest that the relationship between HbA1c and HDL-cholesterol differs between diabetic and non-diabetic groups, with diabetes being associated with distinct metabolic profiles where lipid levels are more closely linked to obesity and inflammation. Notably, in non-diabetic individuals, the association between HDL-cholesterol and HbA1c is independent of glycemia, implying that HDL-cholesterol levels are influenced by factors other than blood glucose, underscoring the complex interplay between lipid metabolism and glycemic control.
Building on these metabolic insights, the LASSO logistic model identified HbA1c, age, education level, marital status, HDL-cholesterol, and C-reactive protein (CRP) as significant predictors of type 2 diabetes. The adjusted HbA1c cutoff value for detecting type 2 diabetes was 7.59%, significantly higher than the unadjusted value (6.05%) and the recommended cutoff (6.50%).
These findings underscore the critical importance of interpreting HbA1c levels within the context of lipid profile biomarkers and glycemic status, especially in non-diabetic individuals. Furthermore, the study presents a robust predictive model for type 2 diabetes risk, integrating HbA1c, demographic factors, and key biomarkers. Further research is warranted to validate these findings and explore whether lipid-specific or population-specific cutoffs could be beneficial to enhance screening accuracy. Regular monitoring of HDL cholesterol levels in non-diabetic individuals with elevated HbA1c may aid in identifying those at higher risk of developing diabetes, thereby facilitating early intervention and prevention strategies.
Abbreviations

T2D

Type 2 Diabetes

IDF

International Diabetes Federation

HbA1c

Glycated Hemoglobin

FBG

Fasting Blood Glucose

TG

Triglycerides

HDL

High-density Lipoprotein

BMI

Body Mass Index

BP

Blood Pressure

SBP

Systolic Blood Pressure

DBP

Diastolic Blood Pressure

WHO

World Health Organization

GOD-PAP

The Glucose Oxidase 4-aminoantipyrine Peroxidase

EDTA

Ethylene Diamine Tetraacetate

CRP

C-reactive Protein

CHOD-PAD

Cholesterol Oxidase 4-aminoantipyrine Peroxidase

CHOD-POD

Cholesterol Oxidase Peroxidase

GOD-PAP

Glycerophosphate Oxidase Peroxidase

LDL

Low-density Lipoprotein

TC

Total Cholesterol

AUC

Area Under the Curve

MSE

Mean Squared Error

RMSE

Root Mean Squared Error

MAE

Mean Absolute Error

AIC

Akaike Information Criterion

BIC

Bayesian Information Criterion

ROC

Receiver Operating Characteristic Curve

PCA

Principal Component Analysis

PC

Principal Component

Acknowledgments
The authors would like to express their gratitude to all the participants who took part in the study, whose valuable insights greatly contributed to the findings of this study. They are also grateful to the staff of the Central Hospital of Yaoundé for their support and cooperation throughout the research process.
Author Contributions
Brice Ulrich Foudjo Saha conceived and designed the study, performed the data analysis, and wrote the original manuscript draft. Aphrodite Tchewonpi Choumessi assisted in the design of the study and contributed to the interpretation of the results. Ismael Teta helped in the design of the study and contributed to the statistical modeling. Jonathan Chefang Kenmoe conducted laboratory experiments and administered the questionnaire. Daliane Naomi Tezempa Latsap assisted in the statistical analysis. Lifoter Kenneth Navti supervised the research and provided critical feedback on the manuscript. Edouard Akono Nantia coordinated the data collection process and provided critical feedback on the manuscript. All authors contributed to the review and editing of the manuscript and approved the final version for submission.
Funding
This study did not receive any specific funding.
Data Availability Statement
The data is available from the corresponding author upon reasonable request.
Conflicts of Interest
The authors declare no conflicts of interest.
References
[1] American Diabetes Association, 6. Glycemic Targets: Standards of Medical Care in Diabetes—2021, Diabetes Care. 2021, 44 (Supplement 1), S73-S84.
[2] International Diabetes Federation, IDF Diabetes Atlas, 10th edn. Brussels, Belgium: 2021. Available from:
[3] Selvin, E., Steffes, M. W., Zhu, H., Matsushita, K., Wagenknecht, L., Pankow, J., Coresh, J., & Brancati, F. L., Glycated hemoglobin, diabetes, and cardiovascular risk in nondiabetic adults, N Engl J Med. 2010, 362(9), 800-811.
[4] Nathan, D. M., Kuenen, J., Borg, R., Zheng, H., Schoenfeld, D., Heine, R. J., & A1c-Derived Average Glucose Study Group, Translating the A1C assay into estimated average glucose values, Diabetes Care. 2008, 31(8), 1473-1478.
[5] Ram, Y., Xu, Y., Cheng, A., Dunn, T., & Ajjan, R. A., Variation in the relationship between fasting glucose and HbA1c: implications for the diagnosis of diabetes in different age and ethnic groups, BMJ Open Diabetes Res Care. 2024, 12(2), e003470.
[6] Xue, T., Jiang, M., Liu, Y., Hu, Q., Zhu, B., Hu, J., Guo, W., Wu, X., Xiong, Y., Shi, X., Zhang, X., Han, X., Li, W., Tong, R., & Long, E., Predicting three-month fasting blood glucose and glycated hemoglobin changes in patients with type 2 diabetes mellitus based on multiple machine learning algorithms, Sci Rep. 2023, 13, 16437.
[7] Ngoufack, J. O., Mbouemboue, O. P., Touko, A. M., Haman, H. S., Amanissa, P. D., Amvene, M. J., & Tamanji, M. T., Relationship between HbA1c level and Cardiometabolic Markers in Diabetic patients from Ngaoundere, Health Sci. Dis. 2018, 19(3), 1-7.
[8] Sherwani, S. I., Khan, H. A., Ekhzaimy, A., Masood, A., & Sakharkar, M. K., Significance of HbA1c Test in Diagnosis and Prognosis of Diabetic Patients, Biomarker Insights. 2016, 11.
[9] Ghazanfari, Z., Haghdoost, A. A., Alizadeh, S. M., Atapour, J., & Zolala, F., A Comparison of HbA1c and Fasting Blood Sugar Tests in General Population, Int J Prev Med. 2010, 1(3), 187-194.
[10] Haase, C. L., Tybjærg-Hansen, A., Nordestgaard, B. G., & Frikke-Schmidt, R., HDL Cholesterol and Risk of Type 2 Diabetes: A Mendelian Randomization Study, Diabetes. 2015, 64(9), 3328–3333.
[11] Fanni, G., Rosato, R., Gentile, L., Anselmino, M., Frea, S., Ponzo, V., Pellegrini, M., Broglio, F., Pivari, F., De Ferrari, G. M., Ghigo, E., & Bo, S., Is HDL cholesterol protective in patients with type 2 diabetes? A retrospective population-based cohort study, J Transl Med. 2020, 18(1), 189.
[12] Femlak, M., Gluba-Brzózka, A., Ciałkowska-Rysz, A., et al., The role and function of HDL in patients with diabetes mellitus and the related cardiovascular risk, Lipids Health Dis. 2017, 16, 207.
[13] Sabanayagam, C., Khoo, E. Y., Lye, W. K., Ikram, M. K., Lamoureux, E. L., Cheng, C. Y., Tan, M. L., Salim, A., Lee, J., Lim, S. C., Tavintharan, S., Thai, A. C., Heng, D., Ma, M. A., Tai, S., Wong, E. S., & Wong, T. Y. T. Y., Diagnosis of diabetes mellitus using HbA1c in Asians: relationship between HbA1c and retinopathy in a multiethnic Asian population, J Clin Endocrinol Metab. 2015, 100(2), 689-696.
[14] Diabetes UK, Diagnostic criteria for diabetes, 2023. Available from:
[15] Karnchanasorn, K., Huang, J., Ou, H.-Y., Feng, W., Chuang, L.-M., Chiu, K. C., & Samoa, R., Comparison of the Current Diagnostic Criterion of HbA1c with Fasting and 2-Hour Plasma Glucose Concentration, Journal of Diabetes Research. 2016.
[16] Wang, B., Liu, M. C., Li, X. Y., Liu, X. H., Feng, Q. X., Lu, L., Zhu, Z., Liu, Y. S., Zhao, W., & Gao, Z. N., Cutoff Point of HbA1c for Diagnosis of Diabetes Mellitus in Chinese Individuals, PLoS One. 2016, 11(11), e0166597.
[17] Charan, J., Biswas, T., How to Calculate Sample Size for Different Study Designs in Medical Research? Indian Journal Psychological Medicine. 2013, 35(2), 121–126.
[18] Bigna, J. J., Nansseu, J. R., Katte, J. C., & Noubiap, J. J., Prevalence of prediabetes and diabetes mellitus among adults residing in Cameroon: A systematic review and meta-analysis, Diabetes Res Clin Pract. 2018, 137, 109-118.
[19] Whelton, P. K., Carey, R. M., Aronow, W. S., et al., 2017 ACC/AHA/AAPA/ABC/ACPM/AGS/APhA/ASH/ASPC/NMA/PCNA guideline for the prevention, detection, evaluation, and management of high blood pressure in adults: a report of the American College of Cardiology/American Heart Association Task Force on Clinical Practice Guidelines, Journal of the American College of Cardiology. 2018, 71(19), 122.
[20] World Health Organization, WHO guidelines on drawing blood: best practices in phlebotomy, Geneva: World Health Organization, 2010.
[21] Trinder, P., Determination of glucose in blood using glucose oxidase with an alternative oxygen acceptor, Annals of Clinical Biochemistry. 1969, 6(1), 24-27.
[22] Friedewald, W. T., Levy, R. I., & Fredrickson, D. S., Estimation of the concentration of low-density lipoprotein cholesterol in plasma, without use of the preparative ultracentrifuge, Clinical Chemistry. 1972, 18(6), 499-502.
[23] Expert Panel on Detection, Evaluation, Executive summary of the third report of the national cholesterol education program (NCEP) expert panel on detection, evaluation, and treatment of high blood cholesterol in adults (adult treatment panel III), JAMA. 2001, 285(19), 2486-2497.
[24] Wisniewski, A., DeLouize, A. M., Walker, T., Chatterji, S., Naidoo, N., Kowal, P., & Snodgrass, J. J., Sustained metabolic dysregulation and the emergence of diabetes: associations between HbA1c and metabolic syndrome components in Tunisian diabetic and nondiabetic groups, J Physiol Anthropol. 2024, 43, 18.
[25] Chait, A., & den Hartigh, L. J., Adipose Tissue Distribution, Inflammation and Its Metabolic Consequences, Including Diabetes and Cardiovascular Disease, Front. Cardiovasc. Med. 2020, 7, 22.
[26] Naqvi, S., Naveed, S., Ali, Z., Ahmad, S. M., Khan, R. Asadullah, Raj, H., Shariff, S., Rupareliya, C., Zahra, F., & Khan, S., Correlation between Glycated Hemoglobin and Triglyceride Level in Type 2 Diabetes Mellitus, Cureus. 2017, 9(6), e1347.
[27] Sinning, C., Makarova, N., Völzke, H., Schnabel, R. B., Ojeda, F., Dörr, M., Felix, S. B., Koenig, W., Peters, A., Rathmann, W., Schöttker, B., Brenner, H., Veronesi, G., Cesana, G., Brambilla, P., Palosaari, T., Kuulasmaa, K., Njølstad, I., Mathiesen, E. B., Wilsgaard, T., Blankenberg, S., Söderberg, S., Ferrario, M. M., & Thorand, B., Association of glycated hemoglobin A1c levels with cardiovascular outcomes in the general population: results from the BiomarCaRE (Biomarker for Cardiovascular Risk Assessment in Europe) consortium, Cardiovasc Diabetol. 2021, 20, 223.
[28] Sharahili, A. Y., Mir, S. A., ALDosari, S., Manzar, M. D., Alshehri, B., Al Othaim, A., Alghofaili, F., Madkhali, Y., Albenasy, K. S., & Alotaibi, J. S., Correlation of HbA1c Level with Lipid Profile in Type 2 Diabetes Mellitus Patients Visiting a Primary Healthcare Center in Jeddah City, Saudi Arabia: A Retrospective Cross-Sectional Study, Diseases. 2023, 11(4), 154.
[29] Zheng, D., Dou, J., Liu, G., Pan, Y., Yan, Y., Liu, F., Gaisano, H. Y., Lu, J., & He, Y., Association Between Triglyceride Level and Glycemic Control Among Insulin-Treated Patients With Type 2 Diabetes, The Journal of Clinical Endocrinology & Metabolism. 2019, 104(4), 1211–1220.
[30] Rodriguez-Gutierrez, R., Mancillas-Adame, L. G., Rodríguez-Tamez, G., Diaz Gonzalez-Colmenero, A., Solis-Pacheco, R. C., Elizondo-Plazas, A. S., Santos-Santillana, K. M., Gonzalez-Sariñana, L., Gonzalez-Nava, V., & Gonzalez-Gonzalez, J. G., Hypertriglyceridemia and Its Association with HbA1c Test: A Prospective In Vivo Controlled Study, Int J Endocrinol. 2019.
[31] Huang, R., Yan, L., & Lei, Y., The relationship between high-density lipoprotein cholesterol (HDL-C) and glycosylated hemoglobin in diabetic patients aged 20 or above: a cross-sectional study, BMC Endocr Disord. 2021, 21, 198.
[32] Gatti, A., Maranghi, M., Bacci, S., Carallo, C., Gnasso, A., Mandosi, E., Fallarino, M., Morano, S., Trischitta, V., & Filetti, S., Poor glycemic control is an independent risk factor for low HDL cholesterol in patients with type 2 diabetes, Diabetes Care. 2009, 32(8), 1550-1552.
[33] Yan, Z., Xu, Y., Li, K., & Liu, L., Association between high-density lipoprotein cholesterol and type 2 diabetes mellitus: dual evidence from NHANES database and Mendelian randomization analysis, Front. Endocrinol. 2024, 15, 1272314.
[34] Zheng, F., Yan, L., Yang, Z., et al., HbA1c, diabetes and cognitive decline: the English Longitudinal Study of Ageing, Diabetologia. 2018, 61, 839–848.
[35] Kyrou, I., Tsigos, C., Mavrogianni, C., Cardon, G., Van Stappen, V., Latomme, J., Kivelä, J., Wikström, K., Tsochev, K., Nanasi, A., Semanova, C., Mateo-Gallego, R., Lamiquiz-Moneo, I., Dafoulas, G., Timpel, P., Schwarz, P. E. H., Iotova, V., Tankova, T., Makrilakis, K., & Manios, Y. on behalf of the Feel4Diabetes-study Group, Sociodemographic and lifestyle-related risk factors for identifying vulnerable groups for type 2 diabetes: a narrative review with emphasis on data from Europe, BMC Endocr Disord. 2020, 20, Suppl 1, 134.
[36] Zhou, H., & Qin, G., Nonparametric Covariate Adjustment for the Youden Index, in Applied Statistics in Biomedicine and Clinical Trials Design, Z. Chen, A. Liu, Y. Qu, L. Tang, N. Ting, and Y. Tsong, Eds. Cham: Springer, 2015.
[37] Fan, J., Upadhye, S., & Worster, A., Understanding receiver operating characteristic (ROC) curves, Canadian Journal of Emergency Medicine. 2006, 8(1), 19-20.
Cite This Article
  • APA Style

    Saha, B. U. F., Choumessi, A. T., Teta, I., Kenmoe, J. C., Latsap, D. N. T., et al. (2025). Association Between Glycated Hemoglobin and Lipid Biomarkers in Diabetic and Non-diabetic Populations for Type 2 Diabetes Detection. International Journal of Diabetes and Endocrinology, 10(1), 1-16. https://doi.org/10.11648/j.ijde.20251001.11

    Copy | Download

    ACS Style

    Saha, B. U. F.; Choumessi, A. T.; Teta, I.; Kenmoe, J. C.; Latsap, D. N. T., et al. Association Between Glycated Hemoglobin and Lipid Biomarkers in Diabetic and Non-diabetic Populations for Type 2 Diabetes Detection. Int. J. Diabetes Endocrinol. 2025, 10(1), 1-16. doi: 10.11648/j.ijde.20251001.11

    Copy | Download

    AMA Style

    Saha BUF, Choumessi AT, Teta I, Kenmoe JC, Latsap DNT, et al. Association Between Glycated Hemoglobin and Lipid Biomarkers in Diabetic and Non-diabetic Populations for Type 2 Diabetes Detection. Int J Diabetes Endocrinol. 2025;10(1):1-16. doi: 10.11648/j.ijde.20251001.11

    Copy | Download

  • @article{10.11648/j.ijde.20251001.11,
      author = {Brice Ulrich Foudjo Saha and Aphrodite Tchewonpi Choumessi and Ismael Teta and Jonathan Chefang Kenmoe and Daliane Naomi Tezempa Latsap and Lifoter Kenneth Navti and Edouard Akono Nantia},
      title = {Association Between Glycated Hemoglobin and Lipid Biomarkers in Diabetic and Non-diabetic Populations for Type 2 Diabetes Detection},
      journal = {International Journal of Diabetes and Endocrinology},
      volume = {10},
      number = {1},
      pages = {1-16},
      doi = {10.11648/j.ijde.20251001.11},
      url = {https://doi.org/10.11648/j.ijde.20251001.11},
      eprint = {https://article.sciencepublishinggroup.com/pdf/10.11648.j.ijde.20251001.11},
      abstract = {Introduction: Type 2 diabetes is a significant global health concern, necessitating a thorough understanding of its metabolic processes for effective management. The role of glycated hemoglobin (HbA1c) is crucial, particularly in relation to lipid biomarkers, which warrants exploration to enhance early detection and prediction of diabetes risk in individuals. Objective: This study aimed to explore the associations between HbA1c and lipid biomarkers in diabetic and non-diabetic individuals and to identify key predictors of type 2 diabetes. Methods: A case-control study at the Central Hospital of Yaoundé involved 70 type 2 diabetes patients and 67 non-diabetic controls. Data on sociodemographic characteristics, blood pressure, and biochemical markers were analyzed using Principal Component Analysis, Spearman’s rank correlation, multivariate linear and logistic regressions, and LASSO logistic regression. Results: The findings demonstrate a differential relationship between HbA1c and HDL-cholesterol in diabetic and non-diabetic groups, with diabetics exhibiting distinct metabolic profiles illustrated with lipid levels more closely associated with obesity and inflammation. Among non-diabetic participants, HbA1c was significantly inversely associated with HDL cholesterol (r = -0.337, p = 0.006), while in diabetic participants, it was positively associated with fasting blood glucose (r = 0.277, p = 0.023). Multivariate linear models indicated that the negative association between HDL cholesterol and HbA1c in non-diabetic participants was glycemia-independent. The predictive model identified HbA1c, age, education level, marital status, HDL cholesterol, and C-reactive protein as key predictors of type 2 diabetes, demonstrating high performance with a pseudo-R-square value of 0.8517, sensitivity of 94.03%, specificity of 96.97%, and an AUC of 0.9948. Notably, the adjusted cutoff value of HbA1c was 7.59%, significantly higher than the unadjusted value of 6.05% (t = 13.52, p = 0.001). Conclusion: The study shows a distinct relationship between HbA1c and HDL-cholesterol, linking diabetes to lipid levels, obesity, and inflammation. These findings emphasize context-specific HbA1c interpretation for better diabetes risk prediction and management.},
     year = {2025}
    }
    

    Copy | Download

  • TY  - JOUR
    T1  - Association Between Glycated Hemoglobin and Lipid Biomarkers in Diabetic and Non-diabetic Populations for Type 2 Diabetes Detection
    AU  - Brice Ulrich Foudjo Saha
    AU  - Aphrodite Tchewonpi Choumessi
    AU  - Ismael Teta
    AU  - Jonathan Chefang Kenmoe
    AU  - Daliane Naomi Tezempa Latsap
    AU  - Lifoter Kenneth Navti
    AU  - Edouard Akono Nantia
    Y1  - 2025/02/10
    PY  - 2025
    N1  - https://doi.org/10.11648/j.ijde.20251001.11
    DO  - 10.11648/j.ijde.20251001.11
    T2  - International Journal of Diabetes and Endocrinology
    JF  - International Journal of Diabetes and Endocrinology
    JO  - International Journal of Diabetes and Endocrinology
    SP  - 1
    EP  - 16
    PB  - Science Publishing Group
    SN  - 2640-1371
    UR  - https://doi.org/10.11648/j.ijde.20251001.11
    AB  - Introduction: Type 2 diabetes is a significant global health concern, necessitating a thorough understanding of its metabolic processes for effective management. The role of glycated hemoglobin (HbA1c) is crucial, particularly in relation to lipid biomarkers, which warrants exploration to enhance early detection and prediction of diabetes risk in individuals. Objective: This study aimed to explore the associations between HbA1c and lipid biomarkers in diabetic and non-diabetic individuals and to identify key predictors of type 2 diabetes. Methods: A case-control study at the Central Hospital of Yaoundé involved 70 type 2 diabetes patients and 67 non-diabetic controls. Data on sociodemographic characteristics, blood pressure, and biochemical markers were analyzed using Principal Component Analysis, Spearman’s rank correlation, multivariate linear and logistic regressions, and LASSO logistic regression. Results: The findings demonstrate a differential relationship between HbA1c and HDL-cholesterol in diabetic and non-diabetic groups, with diabetics exhibiting distinct metabolic profiles illustrated with lipid levels more closely associated with obesity and inflammation. Among non-diabetic participants, HbA1c was significantly inversely associated with HDL cholesterol (r = -0.337, p = 0.006), while in diabetic participants, it was positively associated with fasting blood glucose (r = 0.277, p = 0.023). Multivariate linear models indicated that the negative association between HDL cholesterol and HbA1c in non-diabetic participants was glycemia-independent. The predictive model identified HbA1c, age, education level, marital status, HDL cholesterol, and C-reactive protein as key predictors of type 2 diabetes, demonstrating high performance with a pseudo-R-square value of 0.8517, sensitivity of 94.03%, specificity of 96.97%, and an AUC of 0.9948. Notably, the adjusted cutoff value of HbA1c was 7.59%, significantly higher than the unadjusted value of 6.05% (t = 13.52, p = 0.001). Conclusion: The study shows a distinct relationship between HbA1c and HDL-cholesterol, linking diabetes to lipid levels, obesity, and inflammation. These findings emphasize context-specific HbA1c interpretation for better diabetes risk prediction and management.
    VL  - 10
    IS  - 1
    ER  - 

    Copy | Download

Author Information
  • Abstract
  • Keywords
  • Document Sections

    1. 1. Introduction
    2. 2. Materials and Methods
    3. 3. Results
    4. 4. Discussion
    5. 5. Conclusions
    Show Full Outline
  • Abbreviations
  • Acknowledgments
  • Author Contributions
  • Funding
  • Data Availability Statement
  • Conflicts of Interest
  • References
  • Cite This Article
  • Author Information